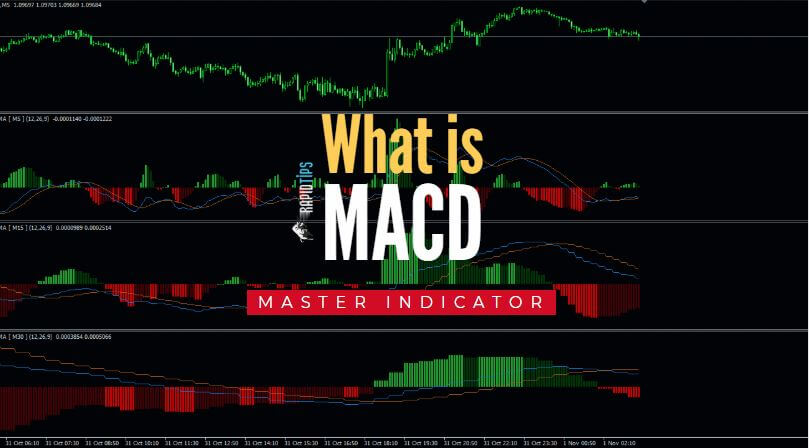
What is MACD in Technical Analysis?: Moving Average Convergence Divergence (MACD) is a very popular trend following indicator and used in technical analysis. Its also called as Mac-Dee. It is developed by Gerald Appel in the late seventies. MACD is one type of oscillator indicator which is used by traders and analyst to gauge the momentum of stocks.
Why MACD is so informative and popular? Because it is a combination of two different types of indicators. First one is, MACD consists of two moving averages of varying lengths (Moving Averages are lagging Indicator) which helps to identify the trend, direction, and duration. The second part of MACD is the histogram which oscillates above and below a center zero Line which indicates security’s momentum. In this article we will learn about what is MACD and How does it work?
What is MACD [Key Notes] :
- MACD is calculated by subtracting EMA of 26 periods from the EMA of 12 periods.
- MACD gives signals when it crosses above (for buy) or below (for sell).
- Not only for buy and sell, but cross over is also used as a signal of overbought and oversold.
- MACD also helps a trader to understand whether the bullish or bearish movement of the stock price is strengthening or weakening.
How MACD works
The MACD indicator is consist of three elements which are MACD line, Signal line, and the MACD histogram.
- The MACD line: It helps to determine the market trend, i.e. upward or downward momentum.
- The Signal line: which is an EMA of the MACD line (9-period EMA) with the MACD line may be helpful to identify potential reversal or to find out entry and exit points.
- Histogram: A graphical representation of the divergence and convergence of the MACD line and the signal line.
# The MACD Line:
The exponential moving average is measured according to the closing price of a stock and the periods used to calculate the two EMAs are usually set as 12 periods (Faster) and 26 periods (Slower).
With different time frame (minutes, hours, days, weeks, months) the periods may be configured, but in this blog, we will discuss daily setting only. These parameters can be changed as per the different trading strategies.
MACD = 12-day EMA – 26-day EMA
“Invest in yourself. Your career is the engine of your wealth.” – Paul Clitheroe
# The Signal lines
The signal line is calculated from a 9-day EMA of the main line and as such provider further insights about its previous movements.
Signal Line = 9-day EMA of MACD Line
When the MACD line and Signal line crossover, it indicates trend reversal signals.
# The MACD histogram
The histogram is a visual record of the relative movements of the MACD line and the signal. It is simply calculated by the given formula:
MACD histogram = MACD Line – Signal Line
⇒ MACD Setting:
The default setting for MACD is based on (12,26,9) period EMAs. However, traders and technical analyst change default parameters as per their strategies for a different time frame. For example, with a longer time frame such as weekly or monthly charts – MACD (5,35,5) is one of the settings used by long term traders.
“The stock market is filled with individuals who know the price of everything, but the value of nothing.” – Phillip Fisher “
Centreline Crossovers
Centreline crossover occurs when the MACD line moves either on the positive or negative area.
When it crosses above the centreline, the positive MACD value indicates that,
the 12-day EMA > 26-day EMA.
A negative MACD is shown when the MACD line cross below the centreline which indicates that,
26-day EMA > 12-day EMA
A positive MACD line indicates a stronger upside trend or momentum, where a negative MACD line indicates a negative momentum.
Signal Line Crossover
Crossover of MACD line and Signal line helps a trader to interpret buying or selling opportunity. Traders find buying opportunity when the MACD line crosses above the signal line, and when MACD line crosses below the signal line, traders interpret it as selling opportunity. It is not always reliable, to use the signal line and MACD line crossover.
“Know what you own, and know why you own it.” – Peter Lynch
MACD Indicator Strategy :
MACD is about the divergence and convergence of the two moving averages. Divergence occurs when the moving average goes away from each other and convergence occurs when the moving averages come towards each other.
The 26-day moving average is slower and lesser reactive to a price change as compared to 12 – day moving average which is faster and plays a major role for the most movements of MACD.
The MACD line Oscillates above and below the center line (zero lines), and the direction is depending on depends on the direction of the moving average cross.
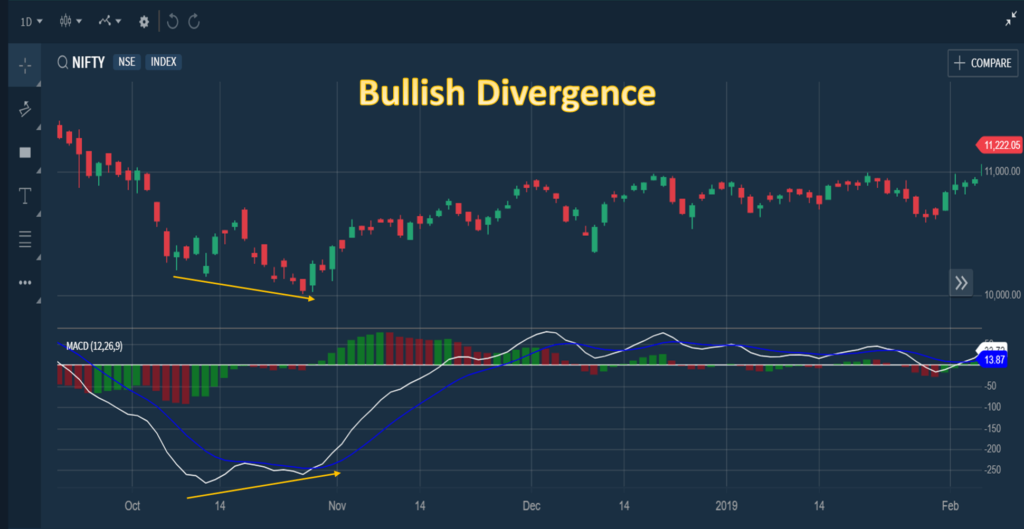
The divergence forms when the MACD divergence from the price action of the stock. A bullish divergence forms when a stock forms lower low and the MACD forms a higher low.
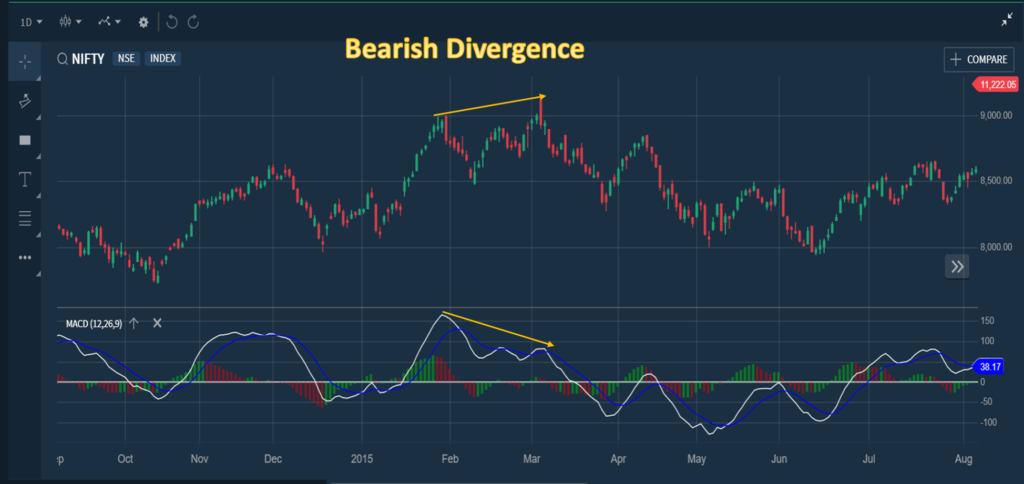
The bearish divergence forms when a stock forms higher high and the MACD forms a lower high.
Conclusion:
The MACD indicator is one of the special indicators because it together includes momentum and trend. This unique mix of momentum and trend can be applied to a minute, daily, weekly or monthly charts with different parameters. The default parameter is MACD (12,26,9). The MACD is not suitable for identifying the overbought and oversold level of security.
By, Rapid Tips