The main base of Intraday Trading Indicator is price movements of stocks. This intraday indicators is used by most of the intraday traders to make the right decisions and for different strategies.
Most Accurate Intraday Trading Indicators are constructed using a combination of the open, high, low or close price data. It combines price and volume for getting information about the direction of the stock.
Intraday Trading Indicator #1. Ichimoku Cloud :
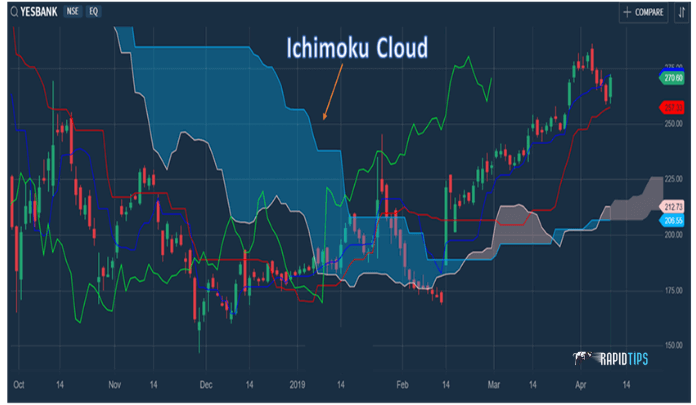
It is also known as Ichimoku Kinko Hyo. The Ichimoku cloud is the versatile indicator that defines support and resistance levels, trend direction and momentum which also provides trading signals.
This Indicator was developed by Goichi Hosoda, and he published in the year 1969. As compared to the standard candlestick chart, it gives more accurate data points.
- The Ichimoku cloud is consist of five calculations or five lines, out of these five lines two of which compose a cloud where the difference between the two lines is shaded in.
- These lines are consisting of a 9-period average, 26 – period average, an average of 9 and 26-period averages, a 52 – period average, and a lagging closing price line.
- The cloud is a main part of the indicator. When the price is below the cloud it indicates the downtrend and if the price is above the cloud the trend is up.
- If the cloud is moving in the same direction as price, then only the trend signals are considered as a stronger trend.
⇒ Formulas of Ichimoku cloud:
Following are the five formulas of the lines that compose the Ichimoku cloud indicator.
- Conversion Line (kenkan sen) = 9-period high + 9-period low / 2
- Base Line (kijun sen) = 26-period high + 26 – period low / 2
- Leading span A (senkou span A) = Conversion line + Baseline / 2
- Leading span B (senkou span B) = 52-period high + 52 – period /2
- Lagging Span (chikou span) = Close plotted 26 periods in the past
You can use the Ichimoku for intraday in combination with other technical indicators for more accurate result in day trading.
Intraday Trading Indicator #2. Super Trend Indicator :
Super trend indicator is one of the most popular indicators among-st intraday trader. It is one of the easiest day trading indicator which is an effective trend following system and it works well in trending markets.
Super Trend Indicator is invented by Olivier Seban. Generally, for intraday trading, it works for 1 minute, 5 minute, or 15 minutes time frame.
Super trend is consist of using two parameters, and the default one is 10 and 3. With the super trend indicator, you can use other indicators to confirm the trading signal.
⇒ Double Super Trend Strategy :
Step for Double super trend strategy:
- The Double bottom strategy is based on a 15 min candle stick time frame.
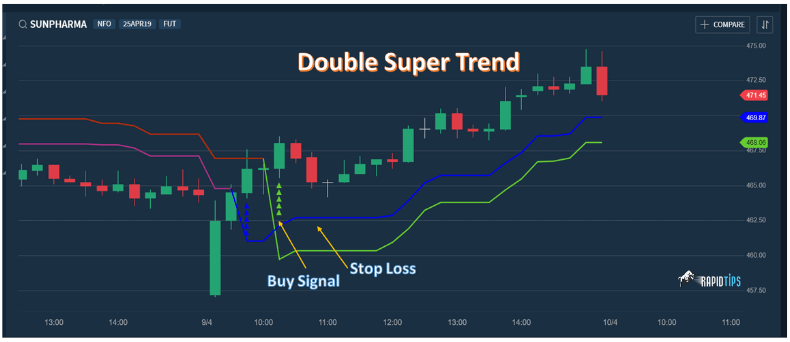
- For this strategy, you need to best trend indicator for intraday with parameter 2 and 10 (blue & purple color)
- Again, input super trend indicator with parameter 3 and 10 (green & red)
- For Buy Signal:
As you can see in the below image, when a green line generates buy signal, you can put stop loss at the blue line.
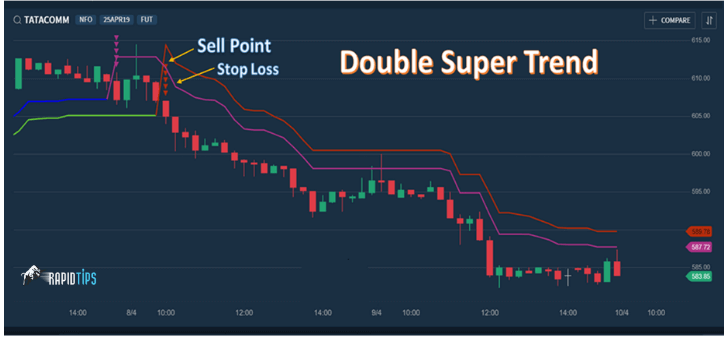
- For Sell Signal:
When Redline generates a red signal, you can put stop loss at the purple line. In the below image you can see the example.
Super Trend Indicator is very easy to use in Intraday Trading but accuracy level is low.
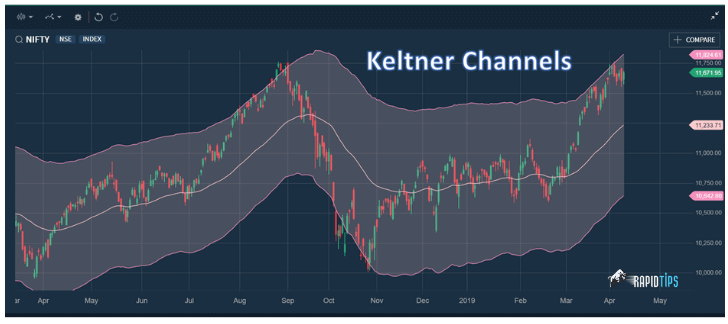
Intraday Trading Indicator #3. Keltner Channel
A Keltner channel is a technical Indicator consist of three separate lines which is based on volatility. Out of these three lines, the middle one is an EMA – Exponential Moving Average of the price and another two lines are placed above and below the EMA. In which, the upper band is set at two times the Average True Range (ATR) above the EMA, and the lower band is set at two times the ATR below the EMA.
⇒ The Formula for a Keltner Channel is
Keltner Channel Middle Line = 20 period EMA
Keltner Channel Upper Band = EMA + (2*ATR)
Keltner Channel Lower Band = EMA – (2*ATR)
Where, EMA = Exponential Moving Average (20 is default parameter & it can be adjusted)
ATR = Average True Range (Which is set at 10 or 20 periods, and it can be adjusted)
Keltner channel is a trend following indicator that identifies the underlying trend. With the combination of momentum indicators, Keltner channels which generate more accurate trading signals.
About Us :
Rapid Tips provides intraday tips for today, best intraday indicator list, bank nifty tips and we also regularly update blogs and articles which helps you to gain more knowledge. Want to know more about us? Kindly drop us an e-mail.